Overview
My Usage offers you a quick snapshot of how much energy you’ve used, and allows you to compare that usage over time and against weather data. Why should you care? Tracking your usage will help you determine if you are using more energy than usual, so you can make adjustments before you get an unexpectedly large bill. In addition, having access to this information can help you make wise energy decisions.
Review Usage Data on your iOS
View Usage for Specific Time
1. On the home screen, tap the My Usage icon.
Usage range options display, along with daily readings for up to the past month. You may need to swipe up to view all available range options.
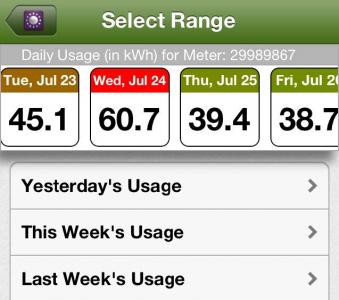
2. Determine the time range you wish to view.
Daily: The readings for a specific day appear horizontally across the top. Swipe back and forth to view the past month. The daily readings are color coded to represent usage levels, ranging from a bright green for lowest usage to a bright red for highest usage. Tapping on a specific day brings up the hourly usage data, if available.
Weekly / Monthly/Yearly/ : You many need to swipe up and down to select the one of these options. You have the choice between this week / month/ year and the last one.
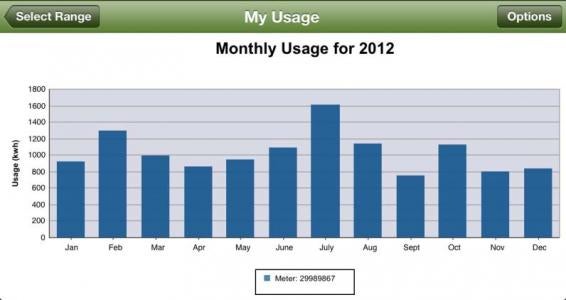
3. Tap the desired time range.
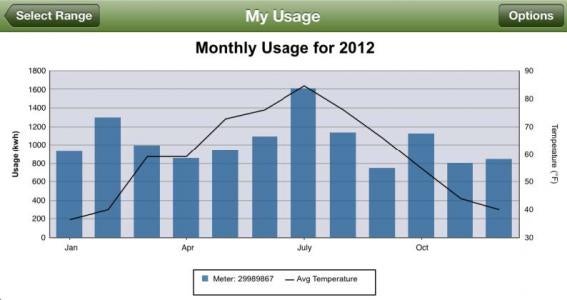
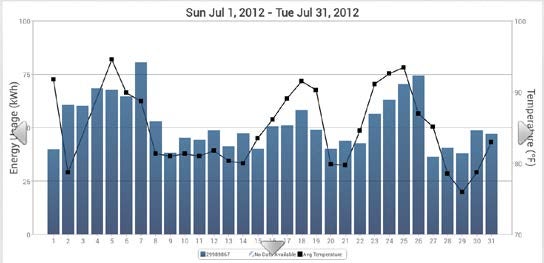
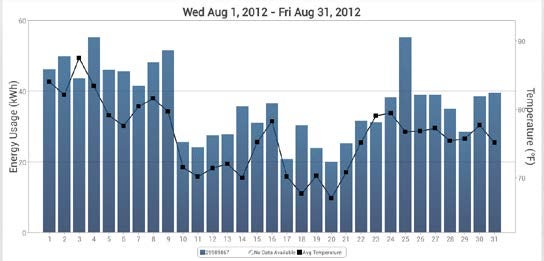
A graph displaying your selected range appears. You may find the graph easier to read when you turn your device sideways.
Drilling Down
If the data is available from your provider, you can drill down to view additional usage information.
1. From a usage graph, tap a specific column.
A new graph appears, presenting the data represented by the column you tapped in the previous graph. For example, if you were viewing a graph of the previous year’s usage, tapping a specific month will bring up graph of the daily usage for that month. Tapping a specific day brings up a graph of the hourly readings for that day.
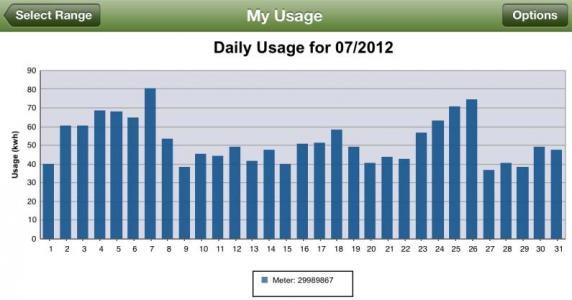
2. Swipe left or right to view the usage from the previous or following day /month / year.
Adding Weather Data
You may find it helpful to compare your energy usage against temperature in order to help determine why you used that amount of electricity. For example, high usage on a hot day might indicate your air conditioner was working overtime.
1. Navigate to any usage graph.
2. Tap the Options button in the top right corner.

The options screen appears.
3. Slide the Show Weather switch to On.
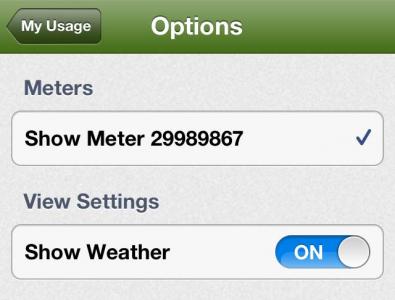
4. Tap My Usage to return to the graph.
The temperature data now appears as a black line across the graph.
Review Usage Data on your Android
View Usage for Specific Time
1. On the home screen, tap the My Usage icon.
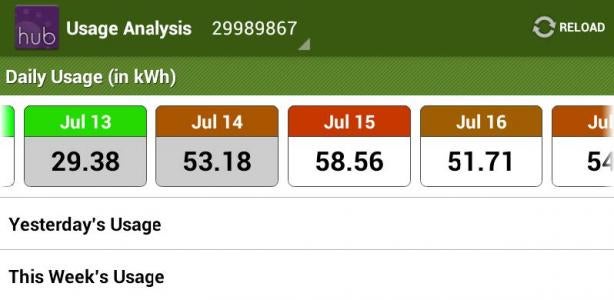
Usage range options display, along with daily readings for the past month. You may need to swipe up to view all available range options.
2. Determine the time range you wish to view.
Daily: The readings for specific days appear horizontally across the top. Swipe back and forth to view the past month. The daily readings are color coded to represent usage levels, ranging from a bright green for lowest usage to a bright red for highest usage. Tapping on a specific day brings up the hourly usage data, if available.
Weekly / Monthly/ Yearly: You many need to swipe up and down to select the one of these options. You have the choice between this week / month/ year and the last one.
3. Tap the desired time range.
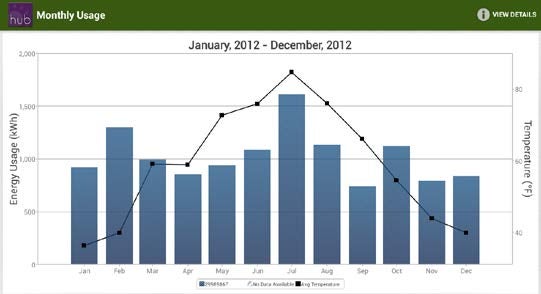
A graph displaying your selected range appears. Average temperatures are represented with a black line across the graph. To read the graph, turn your device sideways.
Drilling Down
If the data is available from your provider, you can drill down to view additional usage information.
1. Double tap a specific column on a usage graph.
A new graph appears, presenting the data represented by the column you tapped in the previous graph. For example, if you were viewing a graph of the previous year’s usage, double tapping a specific month will bring up graph of the daily usage for that month. Double tapping a specific day brings up a graph of the hourly readings for that day.
2. Tap anywhere on the screen.
Arrow navigation buttons appear.
3. Tap a left or right navigation arrow to view the usage from the previous or following day /month/ year.
A new graph appears.
View Details
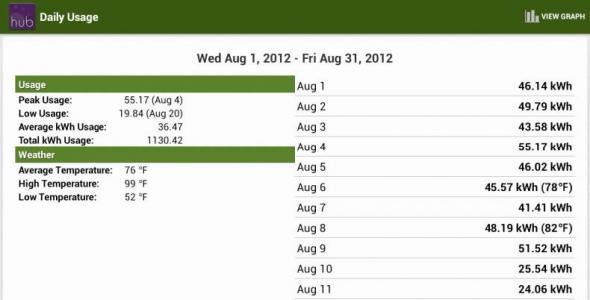
Sometimes the graph’s visual representation might not be the best means for you to get the information you need. The same data can be presented in text form.
1. From any usage graph, tap the View Details button (located in the upper right) to see a text version of the data represented in the graph.

The Details screen appears.
2. Tap the View Graph button (located in the upper right) to return to the graph view.